

Bullet Chart is a custom visual that allows you to show data values, saving precious space on your reports. It can render single or multiple values in a series and show comparison values, different targets, and includes several advanced features.
Ask an AI assistant how to configure and use this visual with the official OKVIZ documentation. Learn how.
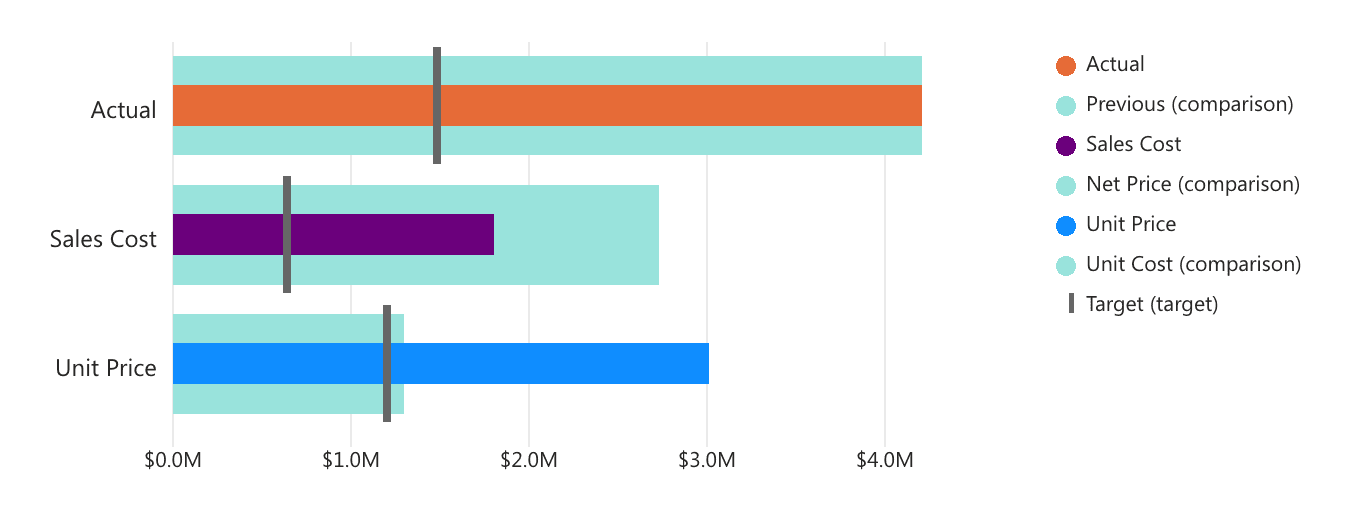
The original bullet chart was created by Stephen Few; he designed it to solve common business intelligence problems in a elegant and meaningful way - we just brought these concepts into Power BI, see Bullet Design.
Download and try Bullet Chart from our website.