Granularities
DRAFT This page is not complete.
Calendar Pro is a visual that allows you to visualize data in a calendar format. Each cell in the calendar represents a period of time. The granularity is the period of time that each cell represents.
Granularity and Grouping
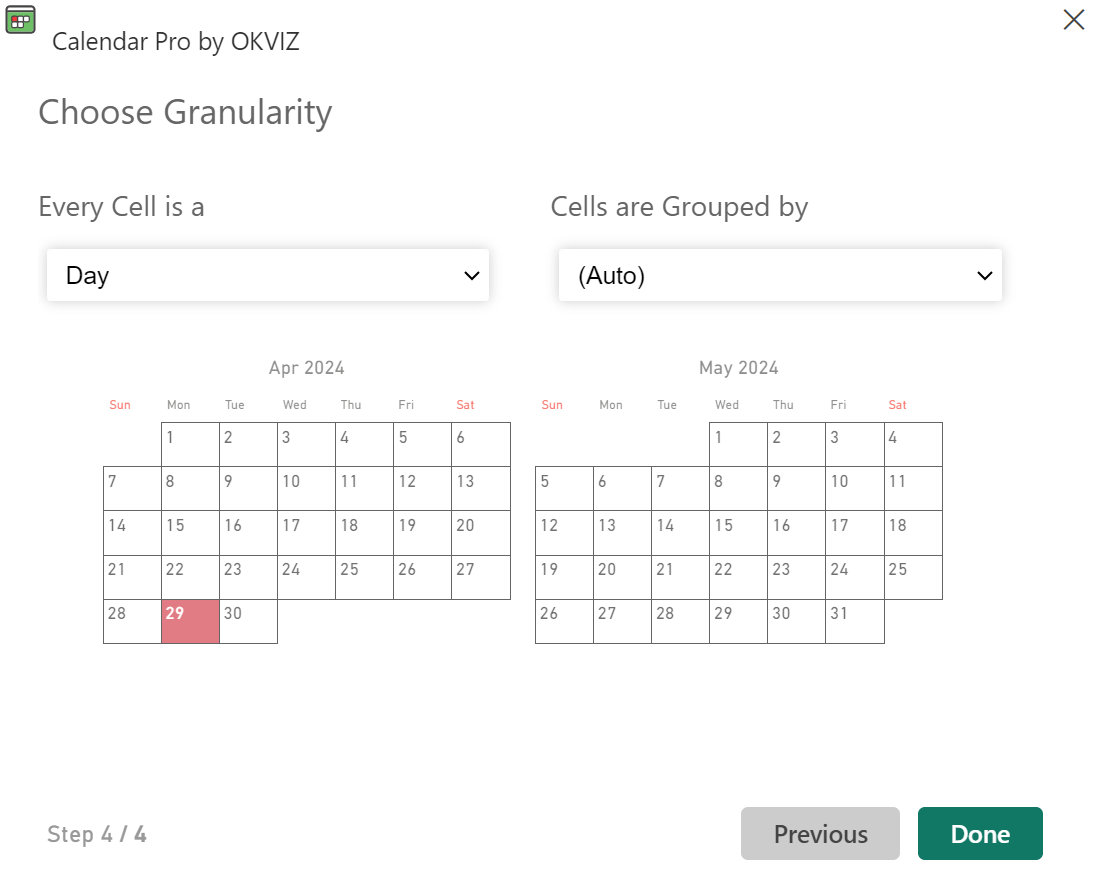
Calendar Pro is an unconventional visual calendar in the sense that it allows you to choose the granularity of the minimum period you want to display (e.g. a day, a week, a quarter, etc.) and the way these periods are grouped.
In particular, each cell can represent a:
- Day
- Week
- Month
- Quarter
- Year
The cells can be grouped as follows:
- (Auto): In this case, Calendar Pro automatically chooses the best grouping based on the granularity.
- (Don’t group): This option does not group the data.
- Weeks
- Months
- Quarters
- Years
A classic month calendar could be represented by setting the granularity as Day and the grouping as Months. In this case, each cell represents a day, and the cells are grouped per month. But Calendar Pro allows you to choose different combinations, like having months grouped by quarter, or days per year, and so on.
Note that when you change the granularity, the underlying data (the values that you could have bound to the visual) are aggregated accordingly by the client (not in Power BI). This could lead to different results than the ones you would obtain by changing the granularity in the Power BI model and it does not work well when you an aggregation that is not sum. To mitigate this, you can use the Granularity option.
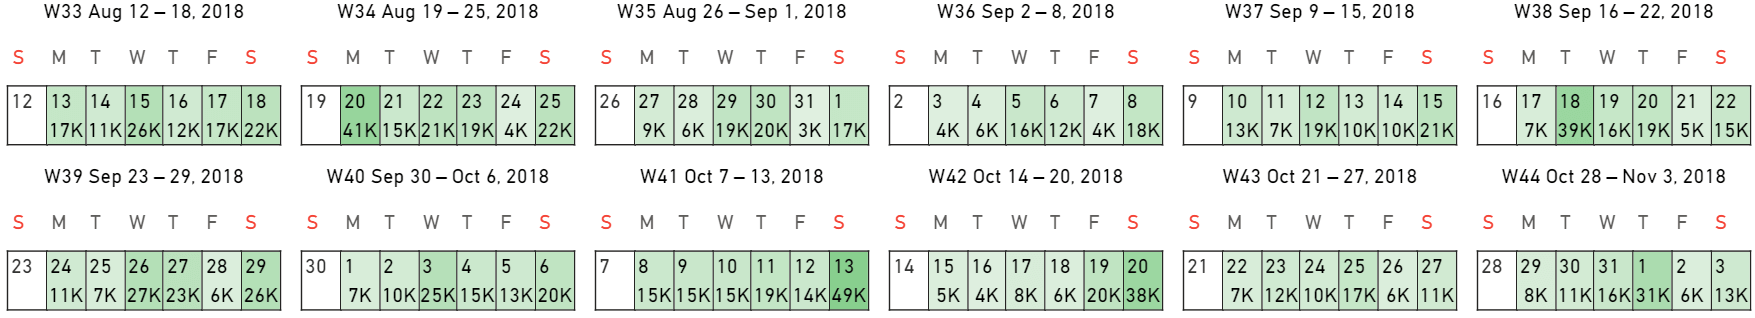
Here are some examples:
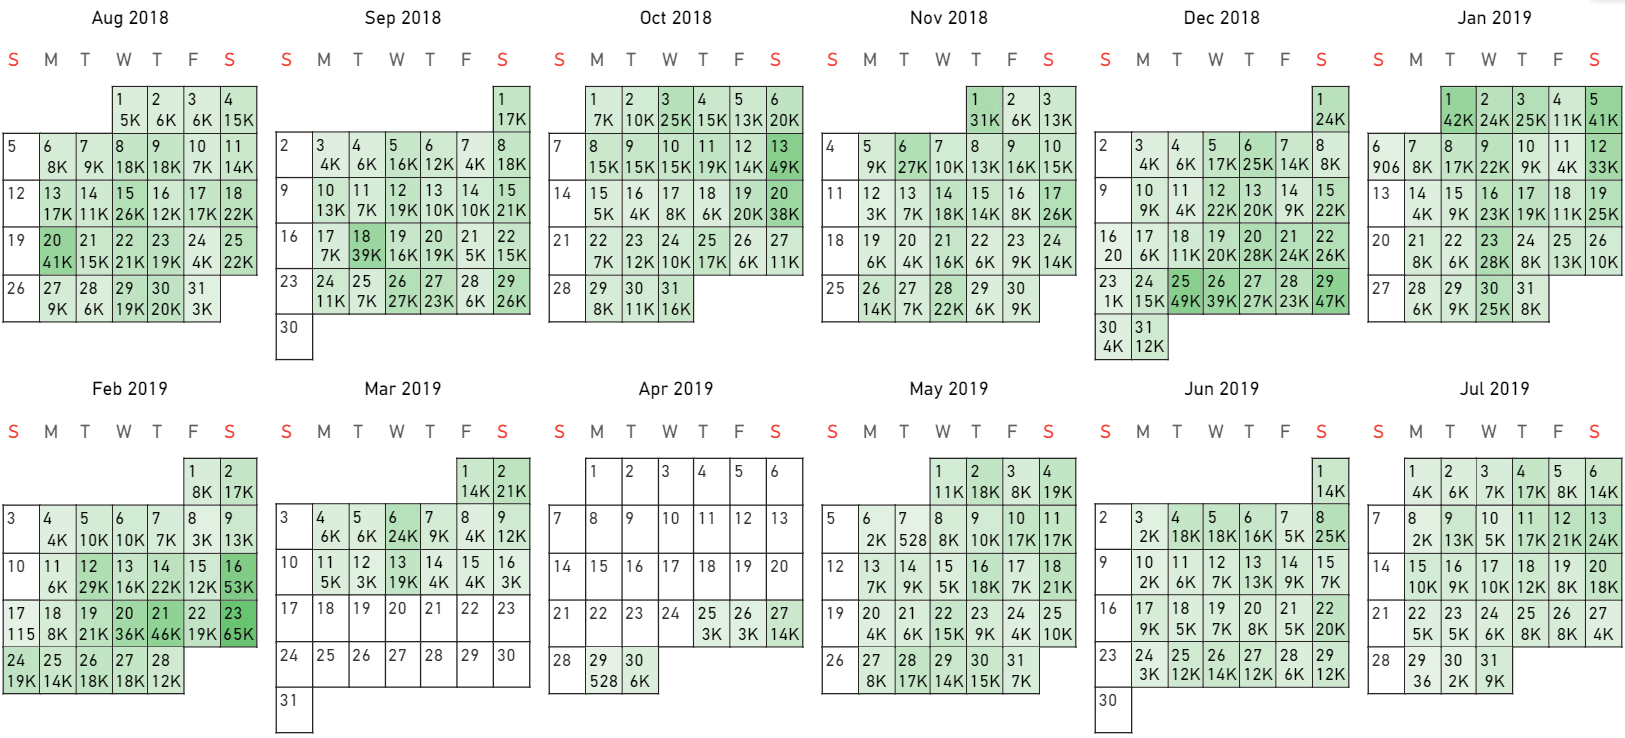
Instead, if each cell represents a day and the data are grouped per month, this is the result:
Navigation
Although you can set granularity and grouping in the options (Granularity options), Calendar Pro allows you to navigate through the data and change the granularity/grouping directly in the visual. This is useful when you want to dynamically display data in different ways without changing the options, or when you are in the Power BI service in Reading view.