Creating SVG Files
SVG files can be created using various tools. This page provides an overview of the different methods to create/edit SVG files for use in Synoptic Panel.
Creating with a Graphic Editor
SVG files can be created using graphic editors, such as Adobe Illustrator, Figma or Inkscape. These tools allow you to create complex shapes, paths, and groups, and to apply styles and effects to the elements of the map.
When creating an SVG file for use in Synoptic Panel, it is important to follow some guidelines to ensure that the map is correctly rendered and that the areas can be linked to the data points:
-
Layer names must be unique: Each layer in the SVG file must have a unique name. This name is used to identify the layer in the Synoptic Panel visual, indeed it is the
idattribute of the element. If you don’t use unique names, the editor will automatically rename the layers to make them unique under the hood and it could lead to unexpected results.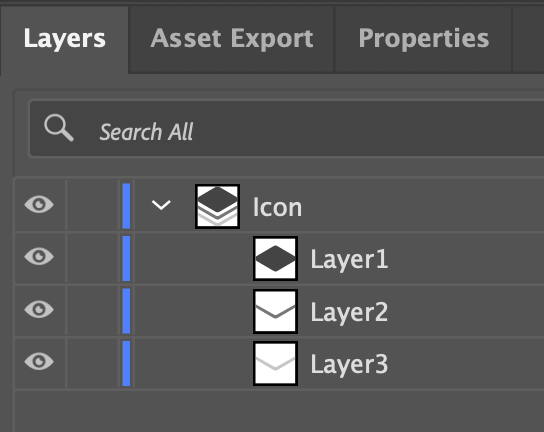
Adobe Illustrator layers panel If you are using the same name because you want to link multiple areas to the same data point, you can use the
data-okviz-strongattribute or the Map Editor. Otherwise, you can group the elements and assign the desired name to the group. -
Keep layer names: When you save the SVG file, make sure that the layer names are kept. This recommendation is relevant when you export optimized SVG files from tools like Adobe Illustrator, which may remove the layer names or rename them to reduce the file size.
-
Save styles as inline: When saving the SVG file, make sure that the styles are saved as inline styles and not as classes. This is important to ensure that the visual settings are correctly applied to the elements of the map.

Adobe Illustrator SVG export settings -
Avoid setting custom attributes before using a graphic editor: Usually, the custom attributes supported by Synoptic Panel are not kept when you open and save the SVG file in a third-party graphic editor. For this reason, it is recommended to use the visual interface of Synoptic Panel to set these attributes when is possible. When this is not possible, you need to manually add the attributes later with a text editor (see below).
Creating with Figma
Since Figma is very popular, free, and easy to use tool, here is a detailed guide on how to create SVG files for Synoptic Panel using Figma.
Editing with a Text Editor
Since SVG files are very similar to HTML, you can edit them with any text editor such as Visual Studio Code or Notepad. This is useful when you need to make small adjustments to the SVG file to enable advanced Synoptic Panel features.
Textual editing is not necessary but could be useful in the following cases:
- Enable the Auto-Fetch mode.
- Forcing the binding of an element of your map to a specific data point, regardless of its id. See more on Data Binding.
- Link an area to a remote map, so to enable users to switch between different maps with drill-down actions. Drill Mode is required.
- Add a custom style to an element bypassing the visual settings. See more on Custom Attributes.
Creating SVG files with a text editor is not recommended for beginners, as it requires a good understanding of the SVG format. If you are new to SVG, it is recommended to use a graphic editor.