The Drill Mode is a feature of Power BI that allows you to navigate through the data hierarchy of a visual. When the Drill Mode is enabled, Power BI provides a set of controls that allow you to drill down or up in the data hierarchy. See more in the official documentation.
In Synoptic Panel, Drill Mode offers a unique capability to interact with different maps at once. This feature allows users to start from an overarching map and drill down to more intricate details or switch between various map layers to display different aspects of the bound data. This feature is particularly useful when you have complex data structures or when you want to provide different perspectives on the same map.
Drill Mode also allows you to circumvent the 30,000 rows limit of Power BI custom visuals, as you can display different maps at different levels of the data hierarchy, each with a subset of the data.
How to Enable Drill Mode
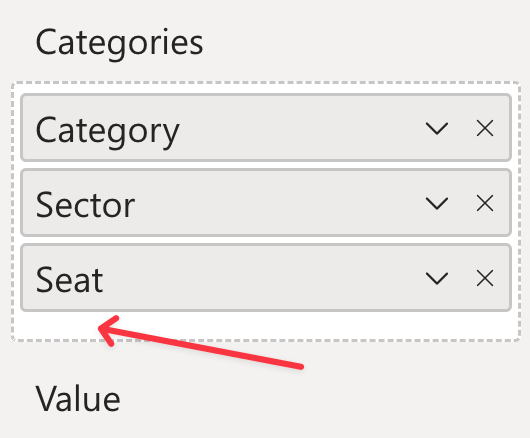
Drill Mode can be enabled in Synoptic Panel by adding more than a column to the Categories field well. In this case, the visual will display only a column at a time, and you can switch between them using the drill controls.
Note that the Drill Mode is available only if your data satisfies some specific requirements. Refer to Drill Mode Requirements for more information.
How to Use Drill Mode
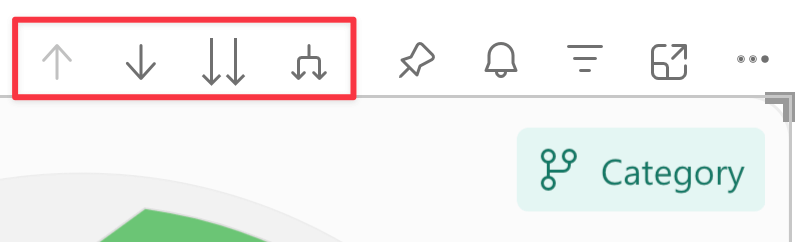
When the Drill Mode is enabled, you will see a set of controls in the visual header that allow you to navigate through the data hierarchy.
-
Drill up: Click on the first button to move to the previous level of the data hierarchy. This action will display the previous column in the Categories field well. If you are already at the top level, this button will be disabled.
-
Drill down one field: Click on the second button activate the drill down mode. You can then click on a map area to move to the next level of the data hierarchy, but limited to the data point bound to the clicked area.
-
Drill down all fields at once: Click on the third button to drill down all the fields of the category column. This feature is not supported by Synoptic Panel.
-
Expand fields: Click on the fourth button to adds another hierarchy level to the current view. This feature is useful to display more detailed maps when a large number of data points. Use this feature with caution, as it can lead to performance issues.
Learn more on the official documentation.
How to Setup Maps on Different Levels
When you enable Drill Mode, you can assign different maps to each level in the hierarchy.
To do this, simply go down to the desired level and import the maps. The visual will remember the maps for that level and display them when you navigate there.
Unfortunately, due to the way Power BI works, there is no other way to assign maps to different levels. The only exception is when you import multiple maps at once using a configuration file. In this case, you can assign maps to different levels by providing the Drill Path, but it is a more advanced feature that requires some knowledge of the path structure (see below).
The Drill Path
The Drill Path is a representation of the current level in the data hierarchy of the visual. It is used to determine which map to display when you navigate to a specific level.
Each map can only be associated with one Drill Path.

The current Drill Path is visible in the visual header (if not disabled), and knowing how it is built is important to understand why in some cases the visual displays a different map than expected.
Here is how the Drill Path is built:
- For each level of the hierarchy, except the last one:
- If there are multiple values in the dataset at that level or the Category Level Maps option is enabled, the name of the column, as defined in the dataset, is taken.
- If there is only one value, the value of the data point is taken. For example, if you drill down on a single data point, the path will take its value.
- For the last level of the hierarchy:
- If the Last Level Maps option is enabled, the behavior is the same as above.
- Otherwise, the name of the column, as defined in the dataset, is taken.
Note that renaming the columns in the visual data bucket won’t affect the path.
Examples
Consider the following dataset:
| Category | Sector | Seat |
|---|---|---|
| Economy | 210 | SPH00847 |
| Economy | 210 | SPH00843 |
| Regular | 404 | SPH05186 |
| Regular | 304 | SPH04540 |
| Best | 306 | SPH09053 |
| … | … | … |
The Drill Path will be different depending on the actions you perform:
| Action | Drill Path |
|---|---|
| Drill down on the Economy category; | Economy > Sector |
| then drill down on the 210 sector, | Economy > 210 > Seat |
| or expand the fields; | Economy > Sector > Seat |
| then apply a single filter on 210; | Economy > 210 > Seat |
| then apply a filter on SPH00847, | Economy > 210 > Seat |
| Expand fields for a single level; | Category > Sector |
| then drill down on the 404 sector. | Regular > 404 > Seat |
| Expand all fields from the top. | Category > Sector > Seat |
Advanced Options
Synoptic Panel offers some advanced options to control the behavior of the Drill Mode:
Child Maps
Child Maps are maps that are not manually imported in the visual but are fetched automatically when you drill down on a specific area with a special attribute or that satisfies the Auto-Fetch conditions.
You can setup child maps in three ways:
-
Manually: by adding the custom attribute
data-okviz-drill-urlto any area directly in the SVG map file. This attribute must contain the URL of a child map to link. -
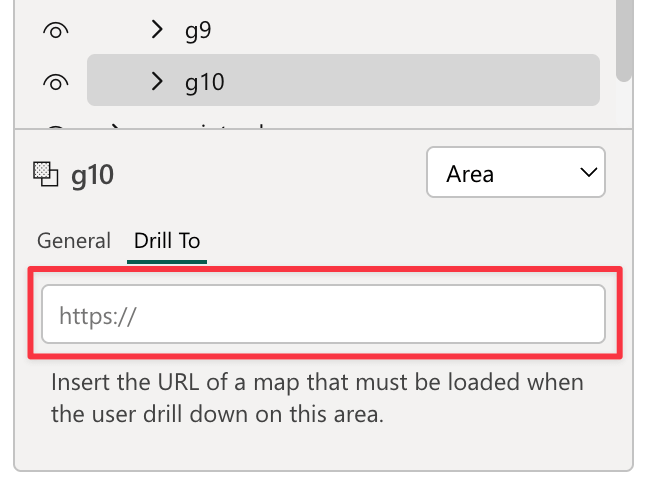
Using the Map Editor: by selecting the Drill To property of an area and providing an URL for the child map.
-
Using AutoFetch (Remote Maps only): by enabling Auto-Fetch and naming the child map with the id of the areas that should be linked. See AutoFetch for more details.
Even though child maps are not directly tied to a specific drill path, they will no longer appear in the visual or the editor once their parent map is deleted. Also, child maps cannot be deleted individually. To remove a child map, you must delete its parent map or manually remove the attribute linking it to the parent map, either using the Map Editor or by editing the SVG code.